Sr Technical Content Strategist and Team Lead
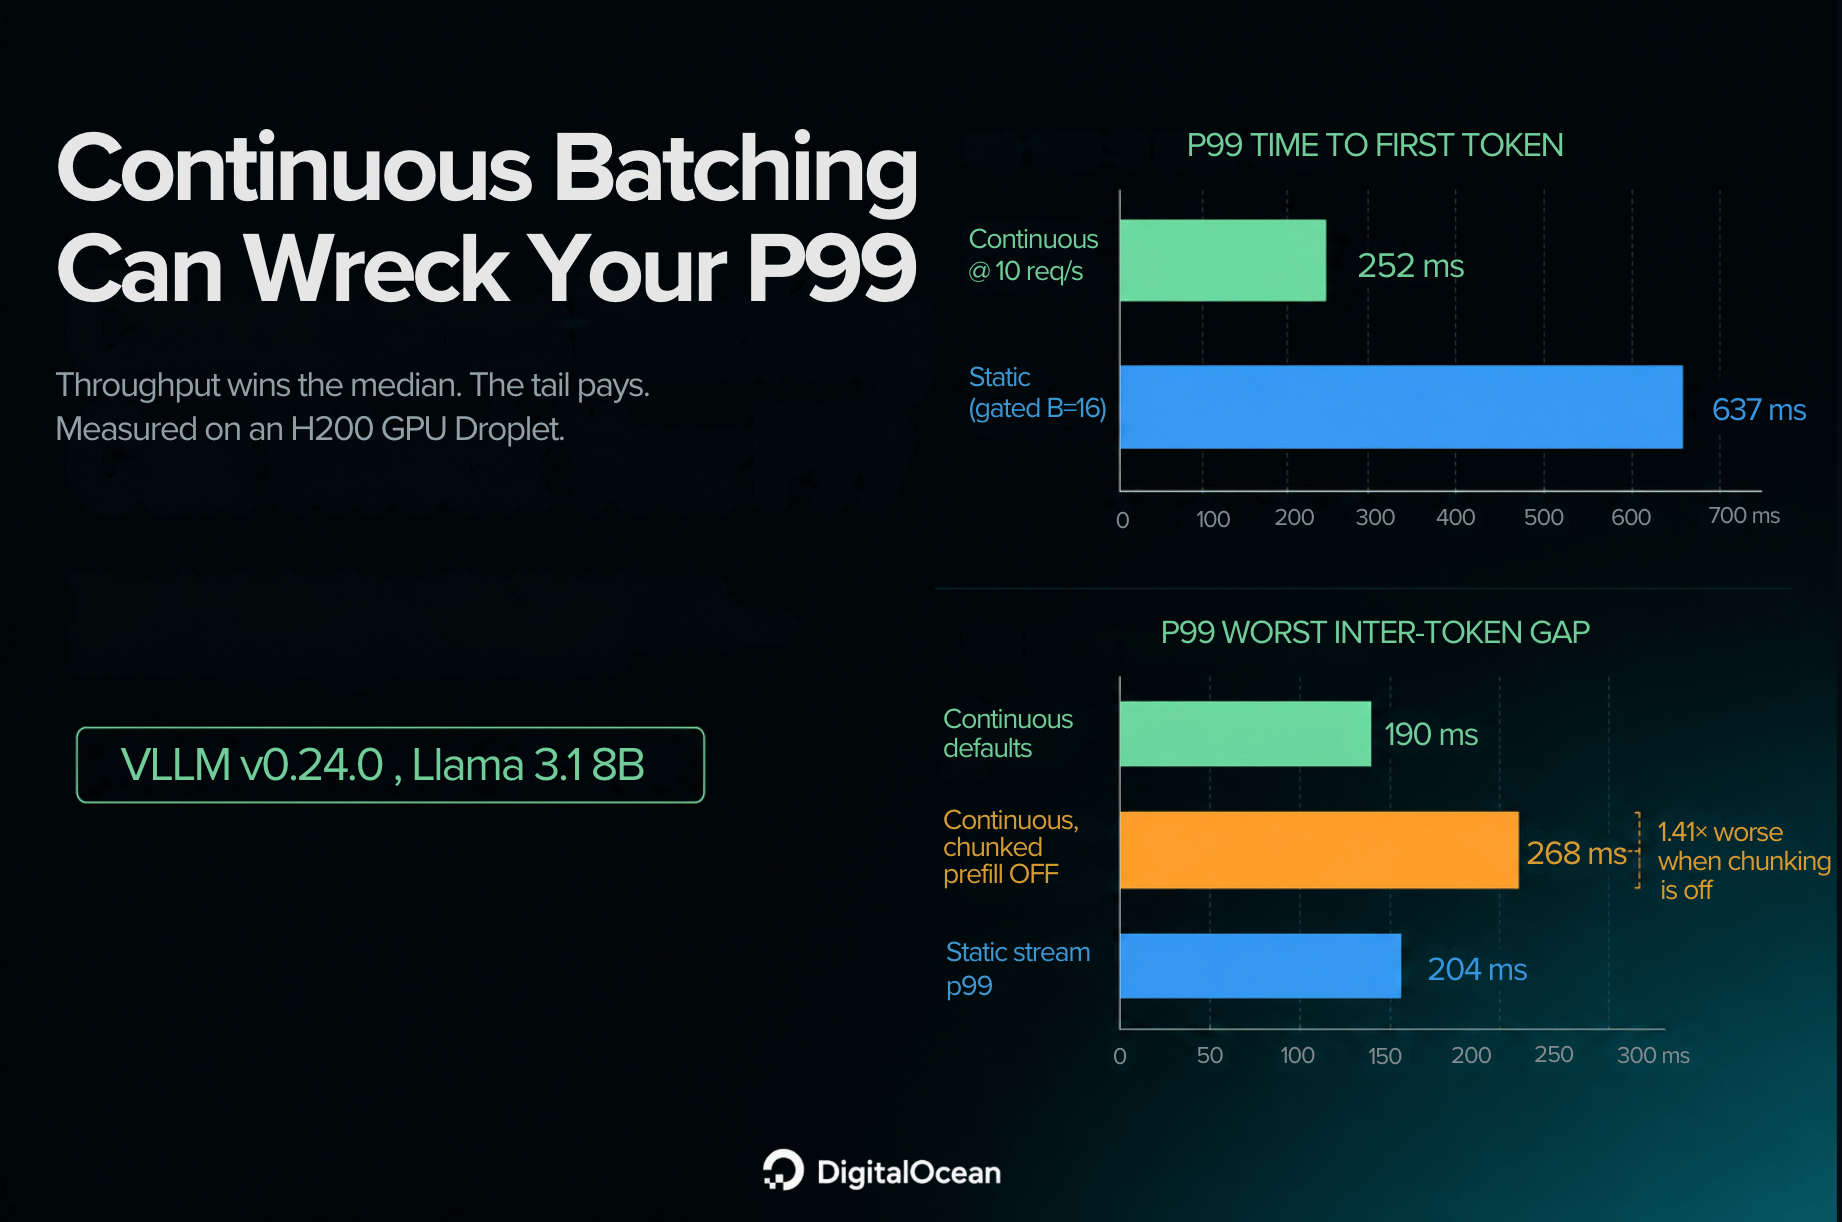
Continuous batching is a core feature of modern LLM serving systems. It’s included in every major engine, routinely appears in comparison charts, and its impact on throughput is well established: Anyscale’s widely cited benchmark reported up to 23x throughput improvements over basic serving setups, while the Orca paper measured up to 36.9x on earlier systems. These results are real, and they mainly describe throughput and median (p50) latency. For example, the title of Anyscale’s post highlights “23x throughput in LLM inference while reducing p50 latency”, underscoring improvements around typical-case performance. This article looks at the impact of continuous batching on latency beyond the median.
The open question is what happens to users experiencing the tail end (p99) of the distribution. This article examines how continuous batching not only shifts the average but reshapes the entire latency profile. While it’s sometimes said that continuous batching dramatically worsens tail latency (p99), the reality is more nuanced: it redistributes latency variance rather than simply increasing it.
With static batching, most delay occurs at admission, which can quickly become a bottleneck under heavy load. Continuous batching, on the other hand, allows near-instant admission but can introduce occasional pauses (jitter) during token streaming. The overall pattern of latency and the tradeoffs involved depend on your workload and engine configuration. This article explores those dynamics, using measured data to illustrate how modern defaults (like those in vLLM) moderate some of the traditional extremes.
Check out the GitHub repository for the raw JSON files, the suite log, the plotting script, the thesis notes, and the three measured charts from the H200 run. The article explains what those numbers mean; the repo is the citable archive.
Test Setup
Everything in this article is a live measurement on a DigitalOcean H200 GPU Droplet running vLLM v0.24.0 with Llama 3.1 8B, driven by a mixed-length traffic trace (mostly short requests, some medium, some long):
- Continuous vs static-style (gated, B=16) admission on the same server, same trace, same seed
- Arrival rates ramped from 1 to 20 requests/second for the continuous arm
- Chunked prefill on vs off, one honest config toggle
Github repository with the raw JSON files, the suite log, the plotting script, the thesis notes, and the three measured charts from the H200 run: github.com/anishsingh20/continuous-vs-static-batching.
TL;DR
- The famous 23x number is a throughput and p50 result, not a tail result. Anyscale’s own benchmark title says “while reducing p50 latency.” The tail behavior under mixed-length concurrent load is the under-documented half of the story, and it is where production pain lives, as my related article on p50 vs p99 Latency: Why Median Benchmarks Mislead AI Agent Workloads argues in general form. Sources: Anyscale continuous batching benchmark, Yu et al., Orca, OSDI 2022.
- Continuous batching’s tail cost appears inside the token stream, through two separable mechanisms: long prefills stalling in-flight decodes, and preemption under KV cache pressure. The GPU Droplet harness below measures the size of both effects on real hardware.
- Modern vLLM defaults already mitigate the first mechanism. vLLM V1 enables chunked prefill by default with a decode-first scheduling policy, per vLLM’s own optimization documentation. The dramatic prefill-stall story describes engines and configurations without this mitigation.
- The second mechanism, preemption, survives the first fix. vLLM V1’s default preemption mode is RECOMPUTE: under KV cache pressure a running request is evicted and its entire prefill runs again later. The engine counts these events in its Prometheus metrics, and the harness in this piece records that counter around every run.
- Static-style admission keeps one genuine advantage the measurement makes visible: a calmer token stream once the answer is running (gated gap p50 52.8 ms vs 129.6 ms for continuous at 10 req/s), because a locked batch admits nothing that could interrupt it. Its niche is real and narrow.
- The GPU experiment ran on an H200 Droplet. Gated admission lost badly on TTFT (p50 196 ms vs roughly 19 to 48 ms continuous). Chunked-prefill-off at 10 req/s worsened worst-gap p99 from 189.9 ms to 267.8 ms (1.41x). Preemptions stayed at zero for 8B on 141 GB. Full JSON and charts: github.com/anishsingh20/continuous-vs-static-batching.
Table of Terms and Concepts
In case you are new to the world of LLM serving, here is a table of terms and concepts that will be used in this article.
| Term you will see | What it means | Simple example |
|---|---|---|
| Request | One user asking the model for an answer. | You send “Summarize this email” and wait for the reply. |
| Token | A small chunk of text the model reads or writes (roughly a short word or part of a word). | The phrase “Digital Ocean” might be a few tokens, not one. |
| Prompt | The text you send in. | Your question plus any system instructions. |
| Prefill | The model’s first job: read the whole prompt before it can start answering. Longer prompts take longer to prefill. | Skimming a 20-page brief before you type the first sentence of a reply. |
| Decode | The model’s second job: write the answer one token at a time. | Typing the reply word by word. |
| Batching | Running several requests on the GPU together instead of one-by-one. | One oven cooking several pizzas in the same heat cycle. |
| Static batching | Take a fixed group of requests, run them together, and finish the whole group before taking new ones. | A restaurant that only seats tables of 16 and does not seat anyone new until that whole party has left. |
| Continuous batching | Let finished requests leave and new ones join after each small step, without waiting for the whole group to finish. | A revolving door: people exit when done; newcomers step in when there is space. |
| Gated / gated admission | Our stand-in for static batching in the live test: the client only sends the next group after the current group all finish. The engine underneath is still continuous. | You personally hold the next 16 tickets at the door until the previous 16 people are done. |
| B or B=16 | Batch size: how many requests are in that gated group. B=16 means groups of 16. | “Tables of 16” in the restaurant picture. |
| Continuous @ 10 req/s | Continuous admission while new requests arrive at about 10 per second. | About 10 new chat messages hitting the server every second. |
| Arrival rate (req/s) | How fast new requests show up. Higher rate = busier server. | 1 req/s is calm; 20 req/s is a rush. |
| Arm | One side of the experiment (one way of admitting requests or one config). | “Continuous arm” vs “gated arm” are two test setups, not two different GPUs. |
| Defaults (chunked on) | Normal modern vLLM settings, including chunked prefill turned on. | The factory settings you get if you do not tweak the server. |
| Chunked prefill | Break a long prompt into smaller pieces and mix those pieces with ongoing answers, so one long read does not freeze everyone else’s stream. | Reading a long book in short chapters while still answering other people between chapters. |
| Chunked off / chunked prefill off | That safety feature is turned off on purpose, so we can see the older, rougher behavior. | Forcing the kitchen to finish one whole giant order before touching anything else on the stove. |
| TTFT (time to first token) | How long until the user sees the first bit of the answer. | The wait before the first word appears in the chat bubble. |
| Worst gap / worst inter-token gap | The longest pause between words while the answer is already streaming. | The reply starts, then freezes mid-sentence for a beat, then continues. |
| p50 | The middle value: half of requests did better, half did worse. | Typical / median experience. |
| p99 | The slow tail: only about 1 in 100 requests were worse than this. | The unlucky user experience you still care about in production. |
| Total time | How long from sending the request until the full answer finishes. | Start to end of one chat reply. |
| Preemption | The server ran out of working memory for in-flight answers and had to kick one out and redo part of its work later. | Clearing a table mid-meal because the dining room is full, then seating them again from scratch. |
| KV cache | The model’s short-term scratchpad for each active conversation while it generates. | Sticky notes the cook keeps for every order still on the stove. |
| H200 / GPU Droplet | The cloud machine with one powerful NVIDIA H200 GPU where we ran the live test. | The physical kitchen used for the measurements. |
| vLLM | The open-source server software that runs the model on the GPU. | The kitchen’s order-management system. |
| Trace | The fixed mix of short, medium, and long fake requests we replay in every test so comparisons are fair. | The same shopping list run through every checkout lane. |
How the two batching models actually work
Every LLM request has two steps. First the model reads your prompt (prefill). Then it writes the answer one token at a time (decode). Batching is only the rule for who shares the GPU while that happens.
| Model | How it works |
|---|---|
| Static batching | Collect a fixed group of requests, run them together, and do not take new ones until that whole group finishes. |
| Continuous batching | After each small GPU step, finished requests leave and waiting ones can join immediately. |
Static makes you wait at the door (slow time to first token). Continuous lets you in fast, but a new long prompt joining mid-flight can make answers already streaming stutter. The subsections below unpack both sides.
Static batching: the batch is a locked room
Static batching is request-level scheduling. The server collects requests until a batch fills or a timer expires, runs all their prefills, then decodes the whole batch together until every sequence in it finishes. Three costs follow directly from the definition.
The batch-fill wait: early arrivals sit idle until the batch fills or times out, paying latency before any compute happens. The longest-sequence floor: the batch releases only when its longest sequence finishes, so a request that needed 100 tokens waits for the neighbor that needed 600, and the whole batch’s occupancy time equals the maximum, not the mean. The utilization decay: as sequences finish, their compute slots idle inside the still-locked batch, so a batch of 16 might spend its final iterations doing the work of 3 while 13 slots do nothing. Those idle gray slots are the exact inefficiency the Orca paper documented before fixing. Source: Yu et al., Orca: A Distributed Serving System for Transformer-Based Generative Models, OSDI 2022, pages 521 to 538.
 The three costs in one picture: the fill wait at the door, the gray dead capacity inside, and the release line set by the slowest occupant.
The capacity consequence is the part that matters for the tail. Static batching’s sustainable throughput is at most B divided by the batch occupancy time, and the occupancy time is set by the longest sequence. Push arrivals past that ceiling and the queue grows without bound, which means admission delay, and with it time to first token, grows without bound too. This is ordinary queueing theory, and it is the mechanism behind the gated arm’s painful admission numbers in the measured results below.
Continuous batching: the batch is a revolving door
Orca’s insight was to schedule at the granularity of a single iteration rather than a whole request. After every forward pass, the scheduler re-decides the batch: sequences that just finished exit immediately and return to their clients, and waiting requests join in the freed capacity, mid-flight. The paper’s own abstract states the problem it fixes in one sentence: requests that finish earlier than others in a batch cannot return to the client, while newly arrived requests must wait for the batch to fully finish. Iteration-level scheduling removes both waits. vLLM builds on the same design and adds PagedAttention, which manages KV cache memory in non-contiguous blocks so that the aggressive, dynamic batch composition continuous batching wants is not defeated by memory fragmentation. Sources: Yu et al., OSDI 2022; Kwon et al., Efficient Memory Management for Large Language Model Serving with PagedAttention, SOSP 2023, pages 611 to 626.
 No fill wait, no dead capacity, no release line. The open question is what joining and leaving mid-flight does to the requests already inside.
Where the tail cost enters
Everything continuous batching wins, it wins by making the batch composition dynamic. The tail cost enters through the same door, by two distinct mechanisms worth keeping separate, because they respond to different fixes.
Mechanism one: prefill insertion. When a new request joins mid-flight, its prompt needs prefill, and prefill is compute-bound. In the scheduling policy vLLM documents for its pre-chunking behavior, the scheduler prioritizes prefills and does not batch prefill and decode into the same forward pass. A 6,000-token prompt arriving becomes a prefill-only iteration during which every in-flight decode stream produces nothing. Each of those streams shows one long inter-token gap, at the same instant, through no fault of their own. The stall repeats every time a long prompt arrives, which under mixed-length traffic is constantly. Source for the scheduling policy description: vLLM Optimization and Tuning documentation.
Mechanism two: preemption under KV pressure. Continuous batching admits aggressively, and every admitted sequence’s KV cache grows with every token it generates. When the cache fills, the scheduler must evict someone. vLLM V1’s documented default preemption mode is RECOMPUTE rather than SWAP: the victim’s cache is dropped and its entire prefill runs again when capacity frees. For the victim this is a mid-stream stall followed by a full second prefill delay, a pure tail event invisible in any median. The engine exposes a cumulative preemption counter through its Prometheus metrics and logs it when disable_log_stats=False is set, which is what makes this mechanism directly observable rather than inferred. Source: vLLM Optimization and Tuning documentation, preemption section.
 The second mechanism survives the fix for the first one. The harness in this piece records the engine’s own preemption counter around every run.
The mitigation that changed the story: chunked prefill
The prefill-insertion mechanism has a documented, deployed fix, and being honest about it is what separates this piece from the folklore. Chunked prefill splits a long prompt into pieces, 2,048 tokens is a representative budget, and batches each piece alongside the ongoing decodes instead of running it alone. The scheduling policy inverts: decodes are scheduled first, every iteration, and prefill chunks fill whatever token budget remains. In-flight streams see slightly wider token spacing while chunks run instead of one long dead gap. The idea was developed in Sarathi-Serve, which framed it as taming the throughput-latency tradeoff by removing prefill-decode interference. Source: Agrawal et al., Taming Throughput-Latency Tradeoff in LLM Inference with Sarathi-Serve, OSDI 2024.
Here is the part any benchmark on this topic must disclose, because it moves the results by an order of magnitude: in vLLM V1, chunked prefill is enabled by default whenever possible, with the decode-first policy active. vLLM’s documentation states the tradeoff both ways with unusual directness: smaller per-iteration token budgets around 2,048 give better inter-token latency because fewer prefill tokens slow the decodes, larger budgets give better time to first token, and budgets above 8,192 are recommended for raw throughput. The dramatic stall story in mechanism one describes engines and configurations without this mitigation, which includes older vLLM versions where the feature was off by default and any current deployment that disabled it or raised the budget far enough to recreate the problem. Source: vLLM Optimization and Tuning documentation.
The single most important config disclosure in any benchmark on this topic. The measured results below quantify exactly how much on-versus-off moves the tail on real hardware.
The experiment
One model, one GPU, one engine build, one request trace, one seed. The only variable is the admission policy, plus one config toggle inside the continuous arm.
- Hardware: DigitalOcean GPU Droplet with size
gpu-h200x1-141gb, NVIDIA H200, region NYC2, created from the 1-Click Inference Ready image. You can check current hourly rates on the GPU Droplet pricing page. - Model: Llama 3.1 8B Instruct at BF16, served as
RedHatAI/Llama-3.1-8B-Instruct(ungated BF16 redistributable of the same lineage). An 8B model keeps decode iterations fast and scheduler dynamics visible without multi-hour wall time. - Engine:
vllm/vllm-openai:v0.24.0. Prefix caching disabled with--no-enable-prefix-cachingso identical filler prompts do not collapse prefill cost. - Trace: 70 percent short, 20 percent medium, 10 percent long, seed
7, 500 measured requests plus 25 warmup per run. Published with the results in the public GitHub repo.
Note: vLLM does not have a traditional static batching mode. It is built entirely around iteration-level continuous batching (also called in-flight or dynamic batching) paired with PagedAttention to maximize GPU utilization and eliminate the idle wait times inherent to static batches
The ramp and the toggle
The continuous arm runs open-loop Poisson arrivals ramped through 1, 5, 10, and 20 requests per second, with 500 measured requests per level after a discarded warmup. The gated arm runs the same trace through its batch gate. The continuous arm then repeats its ramp with chunked prefill explicitly disabled, because the chunked-versus-unchunked delta is the single most decision-relevant number this experiment produces. Both configs are recorded verbatim in the output file.
What gets measured
Per request, in both arms: TTFT from a client-side timestamp on the first streamed content chunk, the worst inter-token gap from timestamps on every chunk, and total completion time. Per run: the engine’s vllm:num_preemptions Prometheus counter scraped before and after, so mechanism two is observed rather than inferred, plus the running batch occupancy if the deployed vLLM version exposes it. Client-side concurrency uses real OS threads rather than a single asyncio loop, for the same reason as the companion latency piece: a 2026 measurement-bias paper models single-process async clients as an M/G/1 queue whose own bottleneck inflates the tail metrics under measurement. Source: Chandrasekar and Kramberger, Identifying and Mitigating Systemic Measurement Bias in Production LLM Inference Benchmarks, arXiv.
 Everything held constant except the admission policy. The gated static arm is disclosed as a stand-in, and the direction of its bias is stated.
Measured results on a DigitalOcean H200 GPU Droplet
This section is the spine of the article. Everything above it explained the mechanisms. Everything below it is what actually happened when the mixed-length trace hit a real engine on a real GPU Droplet.
Github repository: github.com/anishsingh20/continuous-vs-static-batching, containing the harness, per-request JSON, suite log, metadata, and the three charts explained here.
What was held constant
| Field | Value |
|---|---|
| Droplet | size gpu-h200x1-141gb, NYC2 |
| GPU and driver | NVIDIA H200, 143771 MiB |
| Engine image | vllm/vllm-openai:v0.24.0 |
| Model ID served | RedHatAI/Llama-3.1-8B-Instruct (BF16 Llama 3.1 8B Instruct redistributable) |
| Prefix caching | disabled (--no-enable-prefix-caching) so identical filler prompts do not collapse prefill |
| Chunked-disable flag (nochunk arm) | --no-enable-chunked-prefill |
| Preemption counter scraped | vllm:num_preemptions_total |
| Trace | 70% short (200/100), 20% medium (1000/300), 10% long (6000/600), seed 7 |
| Sample size | 500 measured requests + 25 discarded warmup per cell |
The only intentional variables across cells: admission policy (open continuous vs gated B=16), arrival rate for the continuous arm, and one config toggle (chunked prefill on vs off).
How to read each column
- TTFT p50 / p99: client-side time from request send to the first streamed content chunk. This is where gated/static admission usually loses.
- Worst gap p50 / p99: the largest pause between successive streamed chunks inside one response. This is where continuous batching’s prefill-insertion stalls show up. A dashboard that only tracks TTFT will miss it.
- Total p99: end-to-end completion time at the 99th percentile. Under open-loop Poisson load this also reflects queueing while the GPU is busy; it is not a pure “scheduler quality” number by itself.
- Preemptions: delta of
vllm:num_preemptions_totalbefore vs after the run. Nonzero means mechanism two (KV reclaim / RECOMPUTE) actually fired.
Full measured table
| Rate (req/s) | Arm | Config | TTFT p50 | TTFT p99 | Worst gap p50 | Worst gap p99 | Total p99 | Preemptions |
|---|---|---|---|---|---|---|---|---|
| 1 | Continuous | Defaults (chunked on) | 17.0 | 154.0 | 5.9 | 129.7 | 3434.1 | 0 |
| 5 | Continuous | Defaults (chunked on) | 19.3 | 161.2 | 18.3 | 134.9 | 4409.3 | 0 |
| 10 | Continuous | Defaults (chunked on) | 24.1 | 252.2 | 129.6 | 189.9 | 5723.2 | 0 |
| 20 | Continuous | Defaults (chunked on) | 47.7 | 394.8 | 159.9 | 212.7 | 12510.4 | 0 |
| 5 | Continuous | Chunked prefill off | 19.6 | 161.1 | 18.1 | 134.3 | 4482.3 | 0 |
| 10 | Continuous | Chunked prefill off | 24.2 | 249.4 | 129.4 | 267.8 | 5844.2 | 0 |
| n/a | Gated, B=16 | Defaults | 195.8 | 637.2 | 52.8 | 203.6 | 4073.6 | 0 |
All values are milliseconds except the preemption count. Zero errors on every cell.
Row-by-row: continuous arm with engine defaults (chunked on)
Rate 1 req/s. This is the light-load baseline. Median TTFT is 17.0 ms: the request is admitted immediately and the first token arrives quickly. Median worst gap is 5.9 ms, which is a smooth stream. The p99 gap of 129.7 ms and p99 total of 3434.1 ms are already telling you the long-prompt / long-generation tail of the mixed trace is in the data: 10% of requests ask for up to 600 output tokens after a 6,000-token-ish prefill, so the completion-time tail is long even when the scheduler is idle most of the time. Preemptions: 0.
Rate 5 req/s. TTFT barely moves (p50 19.3, p99 161.2). The first place load shows up is the stream: gap p50 rises from 5.9 to 18.3 ms. That is the start of mechanism one under defaults: other requests’ prefills are already sharing iterations with your decode. Total p99 rises to 4409.3 ms. Preemptions still 0.
Rate 10 req/s. This is the knee for this hardware/model/trace. TTFT p50 is still fine at 24.1 ms, but TTFT p99 climbs to 252.2 ms. The smoking gun is gap p50: 129.6 ms. The median request now sees a worst inter-token pause over a hundred milliseconds. Gap p99 is 189.9 ms. If you only watched TTFT medians, you would still believe the system was healthy. Users watching tokens appear on screen would already feel hitching. Total p99 is 5723.2 ms. Preemptions still 0.
Rate 20 req/s. Open-loop pressure is now clearly past comfort. TTFT p50 doubles again to 47.7 ms; TTFT p99 hits 394.8 ms. Gap p50/p99 are 159.9 / 212.7 ms. Total p99 blows out to 12510.4 ms: at this arrival rate the GPU cannot drain the offered load as fast as it arrives, so completion times include real queueing, not just per-request compute. Still zero preemptions: the H200’s KV headroom for an 8B model is enormous for this trace length mix.
Outcome for the continuous-defaults ramp: continuous admission keeps median TTFT small across the ladder, but the token stream roughens as soon as concurrency rises, and by 10 to 20 req/s the tails are load-dominated. That is exactly the “pain moved from the front door into the stream” story from the first half of the piece.
Row-by-row: continuous arm with chunked prefill off
Rate 5, chunked off. Compared to defaults at the same rate, the numbers are almost a copy: TTFT p99 161.1 vs 161.2, gap p99 134.3 vs 134.9, total p99 4482.3 vs 4409.3. At this moderate load on an H200 running 8B, turning chunking off does not recreate the folklore disaster. Publish that. It means V1’s default mitigation and the headroom of this GPU are doing the quiet work.
Rate 10, chunked off. Now the toggle matters, but modestly. TTFT is essentially unchanged (p99 249.4 vs 252.2). Worst-gap p99 rises from 189.9 to 267.8 ms, a 1.41x increase. Gap p50 stays around 129 ms either way. So disabling chunked prefill widens the tail of stream stalls without changing time-to-first-token. Direction of the mechanism: confirmed. Magnitude of the folklore cliff: rejected for this setup.
Row-by-row: gated admission (static stand-in), B=16
Gated is not a second engine. It is the same vLLM server with a client that only ever has 16 in-flight requests, waits for all 16 to finish, then admits the next 16. That reproduces static batching’s external shape: fill boundary, all-finish-together release, longest-sequence occupancy.
Measured: TTFT p50 195.8 ms, TTFT p99 637.2 ms. Against continuous at 10 req/s (24.1 / 252.2), gated’s median TTFT is roughly 8x worse, and its p99 TTFT is 2.5x worse. That is the locked room: early requests in a batch wait for the batch to form and for slow neighbors to finish before the next batch can start, so time-to-first-token absorbs admission delay.
Worst-gap for gated is calmer than continuous under load: gap p50 52.8 ms, gap p99 203.6 ms. The stream is not the disaster mode. Admission is. Total p99 (4073.6 ms) is actually lower than continuous at 10 to 20 req/s in this table because gated naturally rate-limits itself. It never open-loops 20 arrivals per second into the engine, so you cannot read total p99 as “gated is faster overall.” You read it as “gated refuses to accept the same offered load.”
Outcome for gated: static/gated loses at the front door. Its niche remains workloads that need stream smoothness and can engineer around admission delay, not general API serving.
Preemption column: why every cell is zero
Mechanism two is real in vLLM’s docs and in production on tighter GPUs. It did not appear here. An 8B BF16 model on 141 GB of H200 memory, with this prompt/output mix, never forced RECOMPUTE. The harness scraped vllm:num_preemptions_total before and after every run; the delta was 0.0 every time. That is a finding, not a missing measurement: if your p99 story on similar hardware is “we are preempting,” you are probably on a larger model, longer context, higher max_num_seqs. So please keep an eye on the preemption counter in production.
Chart 1: TTFT p99 and worst-gap p99 versus arrival rate
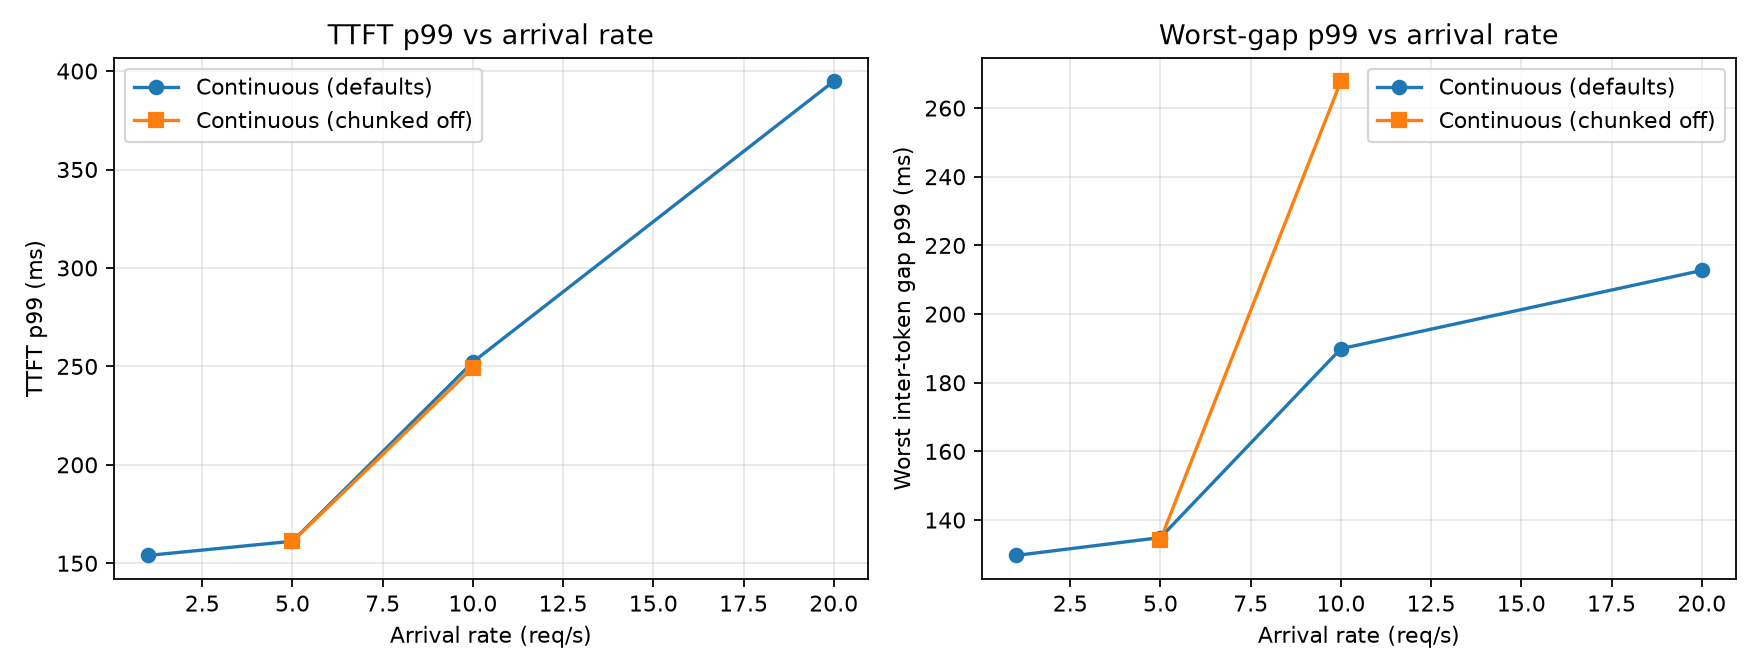
This chart has two side-by-side graphs. Both only cover the “continuous” test (new requests can join anytime).
| Side | Question it answers | What the lines mean | What happened in our test |
|---|---|---|---|
| Left | “How long until the first word shows up when the server gets busier?” | Higher on the graph = users wait longer for the first word. | As we send more requests per second, that wait goes up. Turning “chunked prefill” off barely changes this left graph. |
| Right | “Once the answer is already typing, how bad do the freezes get?” | Higher on the graph = longer awkward pauses mid-sentence. | Freezes get worse as traffic rises. At 10 requests/second, turning chunked prefill off makes the freezes clearly worse (~268 ms vs ~190 ms). |
Takeaway: the left graph is “time to start talking”; the right graph is “stuttering while talking.” Chunked prefill helps the stuttering graph more than the start graph.
Chart 2: p99 comparison across arms at the decision point
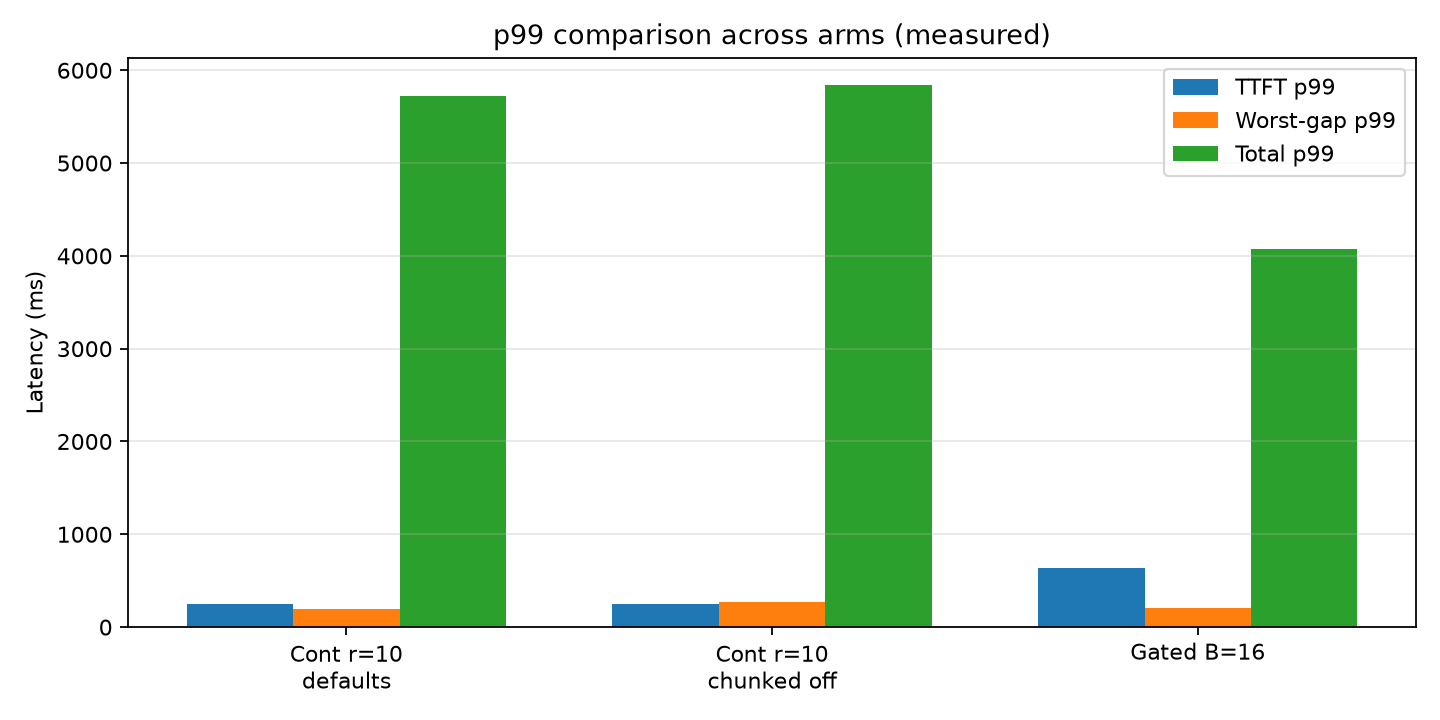
Three grouped bars per arm: TTFT p99, worst-gap p99, total p99.
This is a bar chart with three setups side by side:
- Continuous, normal settings, about 10 new requests every second
- Continuous, same traffic, but chunked prefill turned off
- Gated groups of 16 (our stand-in for old-style static batching)
Each setup has three colored bars:
| Bar color | Plain meaning | Who “wins” in our test |
|---|---|---|
| Blue | Wait before the first word | Continuous wins (much shorter wait). Gated is slow here (~637 ms). |
| Orange | Worst freeze while the answer is typing | Normal continuous is better than “chunked off.” |
| Green | Time until the whole answer is done | Gated can look smaller here, but that is partly because gated only lets 16 requests in at a time, so it never takes the same rush of traffic. Do not treat the green bar alone as “gated is better overall.” |
Takeaway: With continuous, you get a reply faster; with gated, you have to wait in line before anything happens; and if you turn chunked prefill off, the reply comes out in more awkward, choppy bursts, like someone pausing a lot while talking.
What the measurement says (and does not)
Gated/static admission loses exactly where the mechanism analysis said it would: TTFT. Median TTFT for gated B=16 was 195.8 ms against 19.3 ms for continuous at 5 req/s and 24.1 ms at 10 req/s. That is the locked-room fill-and-release cost, measured on real hardware. Worst-gap for gated stayed moderate (p99 203.6 ms), consistent with “smooth stream, painful admission.”
Bottom line from the experiment
- Gated/static admission loses on TTFT, hard. Median 196 ms vs continuous teens-to-low-forties. Confirms the locked-room thesis.
- Continuous’s interactive risk is stream hitching under load, visible in gap p50/p99 from 10 req/s upward, not in median TTFT.
- Chunked prefill still helps, with a measured gap-p99 win of 1.41x at 10 req/s. Folklore overstated the default-config cliff on current vLLM V1.
- Reproduce or cite from the repo: github.com/anishsingh20/continuous-vs-static-batching.
Harness stdout
This is the raw output of the harness. It is a log of the measurements taken during the experiment.
==== CONTINUOUS DEFAULTS RATE RAMP ====
--- continuous rate=1 2026-08-04T07:00:15Z ---
{
  "arm": "continuous",
  "n": 500,
  "started": "2026-08-04T07:00:15Z",
  "rate_or_batch": 1.0,
  "ttft_p50": 17.0,
  "ttft_p99": 154.0,
  "gap_p50": 5.9,
  "gap_p99": 129.7,
  "total_p50": 507.2,
  "total_p99": 3434.1,
  "preemptions_delta": 0.0,
  "errors": 0
}
--- continuous rate=5 2026-08-04T07:09:36Z ---
{
  "arm": "continuous",
  "n": 500,
  "ttft_p50": 19.3,
  "ttft_p99": 161.2,
  "gap_p50": 18.3,
  "gap_p99": 134.9,
  "total_p99": 4409.3,
  "preemptions_delta": 0.0,
  "errors": 0
}
--- continuous rate=10 2026-08-04T07:11:31Z ---
{
  "arm": "continuous",
  "n": 500,
  "ttft_p50": 24.1,
  "ttft_p99": 252.2,
  "gap_p50": 129.6,
  "gap_p99": 189.9,
  "total_p99": 5723.2,
  "preemptions_delta": 0.0,
  "errors": 0
}
--- continuous rate=20 2026-08-04T07:12:30Z ---
{
  "arm": "continuous",
  "n": 500,
  "ttft_p50": 47.7,
  "ttft_p99": 394.8,
  "gap_p50": 159.9,
  "gap_p99": 212.7,
  "total_p99": 12510.4,
  "preemptions_delta": 0.0,
  "errors": 0
}
==== GATED B=16 ====
{
  "arm": "gated",
  "n": 500,
  "rate_or_batch": 16,
  "ttft_p50": 195.8,
  "ttft_p99": 637.2,
  "gap_p50": 52.8,
  "gap_p99": 203.6,
  "total_p99": 4073.6,
  "preemptions_delta": 0.0,
  "errors": 0
}
==== RESTART NO-CHUNK ====
Using chunked-disable flag: --no-enable-chunked-prefill
--- nochunk continuous rate=5 ---
{ "ttft_p99": 161.1, "gap_p99": 134.3, "total_p99": 4482.3, "preemptions_delta": 0.0 }
--- nochunk continuous rate=10 ---
{ "ttft_p99": 249.4, "gap_p99": 267.8, "total_p99": 5844.2, "preemptions_delta": 0.0 }
==== SUITE COMPLETE ====
Runbook: reproducing this test on your DigitalOcean GPU Droplet
What you need before starting. A deployed GPU Droplet with the NVIDIA driver and Docker working (the 1-Click Inference Ready image ships both preinstalled). SSH access to the Droplet. Either Hugging Face access to meta-llama/Llama-3.1-8B-Instruct, or the ungated redistributable RedHatAI/Llama-3.1-8B-Instruct used in the published run. Roughly 30 GB of free disk for BF16 8B weights. Python 3 on the Droplet. Nothing else: the harness uses only the Python standard library. Clone anishsingh20/continuous-vs-static-batching for the harness and plotting scripts.
Step 1. Confirm the GPU is visible.
nvidia-smi
Record the driver version and GPU name from the output into your results file. If this command fails, stop and fix the driver before anything else.
Step 2. Pull the pinned engine image and record its digest.
docker pull vllm/vllm-openai:v0.24.0
docker images --digests | grep vllm
Copy the sha256 digest verbatim into your results file. The pin plus digest is what makes the run reproducible after vLLM’s scheduler changes again.
Step 3. Start the server, arm one, all defaults.
# Meta repo is license-gated; published run used RedHatAI/Llama-3.1-8B-Instruct (ungated BF16).
export HF_TOKEN=your_hugging_face_token_here   # only needed for meta-llama/*

docker run -d --name vllm-default --gpus all --ipc=host -p 8000:8000 \
  -e HUGGING_FACE_HUB_TOKEN=$HF_TOKEN \
  -v ~/.cache/huggingface:/root/.cache/huggingface \
  vllm/vllm-openai:v0.24.0 \
  --model RedHatAI/Llama-3.1-8B-Instruct \
  --no-enable-prefix-caching
V1 defaults leave chunked prefill on (decode-first) per vLLM’s optimization documentation. Prefix caching is disabled so identical filler prompts do not collapse prefill cost across requests. The first start downloads the weights, which takes several minutes. Follow progress with docker logs -f vllm-default and wait for the server-ready line.
Step 4. Health-check the endpoint and the metrics scrape.
curl -s http://localhost:8000/v1/models | head -c 400
curl -s http://localhost:8000/metrics | grep -i preemption
The first command must return a model list containing the exact model ID. The second must return the preemption counter line; note its exact metric name, since the harness scrapes the metrics endpoint and the counter name spelling on your pinned version is worth confirming once by eye. If the grep returns nothing, run curl -s http://localhost:8000/metrics | grep vllm: and record what the counter is called on this version.
Step 5. Save the harness and run the warm-up plus baseline.
Copy the harness from the section below into batching_bench.py on the Droplet, then run the continuous arm across a rate ramp. The correct rates depend on your hardware, so ramp until the tail visibly inflates rather than trusting any fixed list. A reasonable starting ladder for an 8B model on one H200:
python3 batching_bench.py --arm continuous --rate 1  --n 500 --out cont_r1.json
python3 batching_bench.py --arm continuous --rate 5  --n 500 --out cont_r5.json
python3 batching_bench.py --arm continuous --rate 10 --n 500 --out cont_r10.json
python3 batching_bench.py --arm continuous --rate 20 --n 500 --out cont_r20.json
Each run discards 25 warmup requests by default and prints per-level summaries as they finish. If p99 has not moved by rate 20, keep doubling the rate until you find the knee, and record every level you ran.
Step 6. Run the gated arm on the same server.
python3 batching_bench.py --arm gated --batch-size 16 --n 500 --out gated_b16.json
The gated arm submits batches of 16, waits for all to finish, then submits the next batch. This is the disclosed stand-in for true static batching, since vLLM has no static mode, and the piece flags it as mildly flattering to static batching.
Step 7. Restart the server with chunked prefill disabled and rerun the continuous ramp.
docker rm -f vllm-default

docker run -d --name vllm-nochunk --gpus all --ipc=host -p 8000:8000 \
  -v ~/.cache/huggingface:/root/.cache/huggingface \
  vllm/vllm-openai:v0.24.0 \
  --model RedHatAI/Llama-3.1-8B-Instruct \
  --no-enable-prefix-caching \
  --no-enable-chunked-prefill
Verified on the published pin: v0.24.0 accepts --no-enable-chunked-prefill. Flag spellings still shift between releases, so confirm against your image before quoting a different tag. Then repeat rates 5 and 10 with output names such as nochunk_r5.json.
Step 8. Archive everything.
Copy all JSON output files, the digest, the nvidia-smi line, both verbatim docker commands, and the dates and times of each run off the Droplet. Regenerate figures with python3 benchmarks/plot_results.py. The published archive lives at anishsingh20/continuous-vs-static-batching.
The harness
#!/usr/bin/env python3
"""
Batching-policy latency harness for a vLLM server on a DigitalOcean GPU Droplet.

Arms:
  continuous : open-loop Poisson arrivals at --rate req/s (real OS threads)
  gated      : batches of --batch-size, submit all, wait for all, repeat

Per request: TTFT, worst inter-token gap, total time (client-side streaming
timestamps). Per run: vllm preemption counter scraped before and after.

Start the server first (pin the image tag AND record the digest):
  docker run --gpus all -p 8000:8000 vllm/vllm-openai:v0.24.0 \
    --model meta-llama/Llama-3.1-8B-Instruct
  # chunked-off arm: add  --no-enable-chunked-prefill
  # (verified on v0.24.0; re-check if you change the pin)

Run:
  python3 batching_bench.py --arm continuous --rate 5 --n 500 --out cont_r5.json
  python3 batching_bench.py --arm gated --batch-size 16 --n 500 --out gated.json
"""
import argparse, concurrent.futures, json, os, random, threading, time
import urllib.request

def make_trace(n, seed):
    rng = random.Random(seed)
    trace = []
    for i in range(n):
        r = rng.random()
        if r < 0.70: p, o = 200, 100
        elif r < 0.90: p, o = 1000, 300
        else: p, o = 6000, 600
        trace.append({"id": i, "prompt_tokens": p, "max_tokens": o})
    return trace

def build_prompt(n_tokens):
    # ~1 token per word for a filler word; exactness is not required,
    # only that both arms use the identical trace.
    return "ocean " * n_tokens

def percentile(xs, p):
    xs = sorted(xs)
    k = (len(xs) - 1) * p / 100
    f = int(k); c = min(f + 1, len(xs) - 1)
    return xs[f] if f == c else xs[f] * (c - k) + xs[c] * (k - f)

def scrape_preemptions(base):
    """Prefer vllm:num_preemptions_total (v0.24+); fall back to unlabelled name."""
    try:
        with urllib.request.urlopen(base.replace("/v1", "") + "/metrics", timeout=10) as r:
            lines = r.read().decode().splitlines()
        for prefix in ("vllm:num_preemptions_total", "vllm:num_preemptions"):
            for line in lines:
                if line.startswith(prefix) and not line.startswith(prefix + "_"):
                    return float(line.split()[-1])
    except Exception:
        pass
    return None

def one_request(base, model, item):
    payload = {
        "model": model,
        "prompt": build_prompt(item["prompt_tokens"]),
        "max_tokens": item["max_tokens"],
        "temperature": 0,
        "stream": True,
    }
    req = urllib.request.Request(
        base + "/completions",
        data=json.dumps(payload).encode(),
        headers={"Content-Type": "application/json",
                 "Authorization": "Bearer " + os.environ.get("VLLM_API_KEY", "none")},
    )
    start = time.perf_counter()
    ttft = None; last = None; worst_gap = 0.0; n_chunks = 0
    try:
        with urllib.request.urlopen(req, timeout=600) as r:
            for raw in r:
                line = raw.decode(errors="ignore").strip()
                if not line.startswith("data:") or line[5:].strip() == "[DONE]":
                    continue
                now = time.perf_counter()
                if ttft is None:
                    ttft = (now - start) * 1000
                else:
                    worst_gap = max(worst_gap, (now - last) * 1000)
                last = now; n_chunks += 1
    except Exception as e:
        return {"id": item["id"], "error": str(e)}
    return {"id": item["id"], "ttft_ms": round(ttft, 1),
            "worst_gap_ms": round(worst_gap, 1),
            "total_ms": round((last - start) * 1000, 1), "chunks": n_chunks}

def run_continuous(base, model, trace, rate, seed):
    rng = random.Random(seed + 1)
    results = []; lock = threading.Lock()
    with concurrent.futures.ThreadPoolExecutor(max_workers=256) as pool:
        futures = []
        for item in trace:
            futures.append(pool.submit(one_request, base, model, item))
            time.sleep(rng.expovariate(rate))
        for f in concurrent.futures.as_completed(futures):
            with lock:
                results.append(f.result())
    return results

def run_gated(base, model, trace, batch_size):
    results = []
    for i in range(0, len(trace), batch_size):
        batch = trace[i:i + batch_size]
        with concurrent.futures.ThreadPoolExecutor(max_workers=batch_size) as pool:
            futures = [pool.submit(one_request, base, model, it) for it in batch]
            for f in concurrent.futures.as_completed(futures):
                results.append(f.result())
        # the gate: nothing new is admitted until every request above returned
    return results

def main():
    ap = argparse.ArgumentParser()
    ap.add_argument("--base-url", default="http://localhost:8000/v1")
    ap.add_argument("--model", default="meta-llama/Llama-3.1-8B-Instruct")
    ap.add_argument("--arm", choices=["continuous", "gated"], required=True)
    ap.add_argument("--rate", type=float, default=5.0)
    ap.add_argument("--batch-size", type=int, default=16)
    ap.add_argument("--n", type=int, default=500)
    ap.add_argument("--warmup", type=int, default=25)
    ap.add_argument("--seed", type=int, default=7)
    ap.add_argument("--out", required=True)
    args = ap.parse_args()

    trace = make_trace(args.n + args.warmup, args.seed)
    pre = scrape_preemptions(args.base_url)
    t0 = time.strftime("%Y-%m-%dT%H:%M:%SZ", time.gmtime())

    if args.arm == "continuous":
        recs = run_continuous(args.base_url, args.model, trace, args.rate, args.seed)
    else:
        recs = run_gated(args.base_url, args.model, trace, args.batch_size)

    post = scrape_preemptions(args.base_url)
    good = [r for r in recs if "error" not in r][args.warmup:]
    tt = [r["ttft_ms"] for r in good]
    gp = [r["worst_gap_ms"] for r in good]
    to = [r["total_ms"] for r in good]
    summary = {
        "arm": args.arm, "n": len(good), "started": t0,
        "rate_or_batch": args.rate if args.arm == "continuous" else args.batch_size,
        "ttft_p50": round(percentile(tt, 50), 1), "ttft_p99": round(percentile(tt, 99), 1),
        "gap_p50": round(percentile(gp, 50), 1), "gap_p99": round(percentile(gp, 99), 1),
        "total_p50": round(percentile(to, 50), 1), "total_p99": round(percentile(to, 99), 1),
        "preemptions_delta": (post - pre) if (pre is not None and post is not None) else None,
        "errors": len(recs) - len(good) - args.warmup,
    }
    with open(args.out, "w") as f:
        json.dump({"summary": summary, "records": good}, f, indent=2)
    print(json.dumps(summary, indent=2))

if __name__ == "__main__":
    main()
Reading the measured results as a checklist
Use this checklist when you open someone else’s batching benchmark, or when you re-run the harness from the Github repository.
- Did TTFT explode while gaps stayed flat? That is gated/static admission (or a server that is simply overloaded before the first token). Our gated arm: TTFT p50 195.8 ms, gap p99 only 203.6 ms.
- Did gaps explode while TTFT medians looked fine? That is continuous prefill insertion (mechanism one). Our continuous defaults: at 10 req/s, TTFT p50 still 24.1 ms while gap p50 jumped to 129.6 ms.
- Did turning chunked prefill off make gaps much worse? If yes, you attributed mechanism one correctly. Ours: gap p99 189.9 to 267.8 ms at 10 req/s (1.41x). If the delta is tiny, say so, since defaults may already be doing the job.
- Did
vllm:num_preemptions_totalmove? If yes, mechanism two is in play and the fix is KV headroom /max_num_seqs, not more folklore about batching. Ours: never moved. - Was the trace mixed-length? Homogeneous short prompts hide both mechanisms. Our seed-
7mix is published with the JSON.
When to use which
Continuous batching, engine defaults. Throughput-dominated work: offline scoring, evaluation suites, synthetic data, summarization queues. Nobody watches a spinner, so intra-stream jitter is free, and the 23x-class throughput advantage is the whole story. Raise the token budget per vLLM’s guidance and stop tuning.
Continuous batching, tail levers engaged. Interactive serving with a p99 SLA and mixed-length traffic: chat, agents, anything streaming to a human. Keep chunked prefill on, keep the budget modest, watch the preemption counter, and measure the worst inter-token gap rather than only TTFT, because that is where this piece’s mechanisms hide from standard dashboards. If long-context requests share the deployment, route them elsewhere first and tune second.
Gated or static admission. Two honest niches. Hard real-time inner loops with fixed-size, fixed-length batches, where an uninterrupted token stream is the requirement and admission delay is engineered away by construction. And offline jobs with near-identical sequence lengths, where the locked room wastes nothing because everyone finishes together anyway. General API serving is neither of these.
 Continuous is the default. The decision is which levers you pull, and the two static niches are real but narrow.
Conclusion
Continuous batching offers a powerful tool for improving p50 latency in LLM inference workloads, but it also introduces challenges at higher percentiles, sometimes leading to significant increases in p99 latency. This article has demonstrated how the choice of batching policy and the use of features like chunked prefill can dramatically shift performance characteristics, particularly for tail latency. Chunked prefill can help curb the worst gaps, providing a practical lever for mixed and real-time workloads where predictability truly matters.
If you experiment with different GPUs, model sizes, or settings and observe different impacts, especially regarding chunked prefill or preemptions, your results are valuable to the community. Please consider sharing by opening an issue or pull request on the Github repository with your run_metadata.json and benchmark summaries. The exact numbers may vary, but the larger patterns of how admission strategies and engine features affect different latency metrics are widely applicable.
Ultimately, there is no one-size-fits-all solution. Rather, understanding these mechanisms empowers you to make informed choices based on your workload, leveraging continuous batching for massive throughput where possible, or tuning for interactive, tail-sensitive scenarios where user experience comes first. With thoughtful configuration and measurement, you can get the best of both worlds: efficient utilization and predictable performance.
References
Papers
- Yu et al., Orca: A Distributed Serving System for Transformer-Based Generative Models, OSDI 2022
- Kwon et al., Efficient Memory Management for Large Language Model Serving with PagedAttention, SOSP 2023
- Agrawal et al., Taming Throughput-Latency Tradeoff in LLM Inference with Sarathi-Serve, OSDI 2024
- Chandrasekar and Kramberger, Identifying and Mitigating Systemic Measurement Bias in Production LLM Inference Benchmarks, arXiv
Engine documentation and benchmarks
- vLLM Optimization and Tuning
- Anyscale, How continuous batching enables 23x throughput in LLM inference while reducing p50 latency
- Anyscale benchmark code repository
DigitalOcean documentation and related articles
- p50 vs p99 Latency: Why Median Benchmarks Mislead AI Agent Workloads (companion Community tutorial on why p50 alone misleads)
- When Your vLLM p99 is Worse Than Your p50 (companion Community article on why p99 can be worse than p50)
- Continuous Batching vs Static Batching: LLM Inference (companion Community article on continuous batching vs static batching)
- GPU Droplets (product used for the live H200 measurement)
- GPU Droplet pricing (check current hourly rates; do not trust a stale number from any article)
- 1-Click Inference Ready image, DigitalOcean Marketplace (image used to create the benchmark Droplet)
- anishsingh20/continuous-vs-static-batching (companion GitHub repo: harness, raw JSON, charts, suite log)
Thanks for learning with the DigitalOcean Community. Check out our offerings for compute, storage, networking, and managed databases.
About the author
Anish is a Sr Technical Content Strategist and Team Lead at DigitalOcean with 7+ years of experience as an DevOps SRE at Nutanix and Cloud consultant at AMEX, and technical writing at DOCN, and shipping deep infra and AI inference tutorials that help AI-Native Enterprises and teams deploy production‑ready applications on DigitalOcean.
Still looking for an answer?
 This work is licensed under a Creative Commons Attribution-NonCommercial- ShareAlike 4.0 International License.
Become a contributor for community
Get paid to write technical tutorials and select a tech-focused charity to receive a matching donation.
DigitalOcean Documentation
Full documentation for every DigitalOcean product.

Resources for startups and AI-native businesses
The Wave has everything you need to know about building a business, from raising funding to marketing your product.
The developer cloud
Scale up as you grow — whether you're running one virtual machine or ten thousand.

Start building today
From GPU-powered inference and Kubernetes to managed databases and storage, get everything you need to build, scale, and deploy intelligent applications.